Annual Internet Trends Report 2017
by KPCB
Energy Brand Design Agency • August 2017
Every year Mary Meeker of KPCB presents an annual summary of the year-to-date statistics on online trends. This year it is a whopping 355 page analysis (which you may peruse in full here).
We have picked out some of the most interesting and relevant points to our industry:
Advertising
- Time spent per adult per day on mobile devices has increased massively, from 0.3 hours in 2011 to 3.1 hours in 2016. More than ever, people browse on the go, rather than sat at a desk with a laptop or computer.
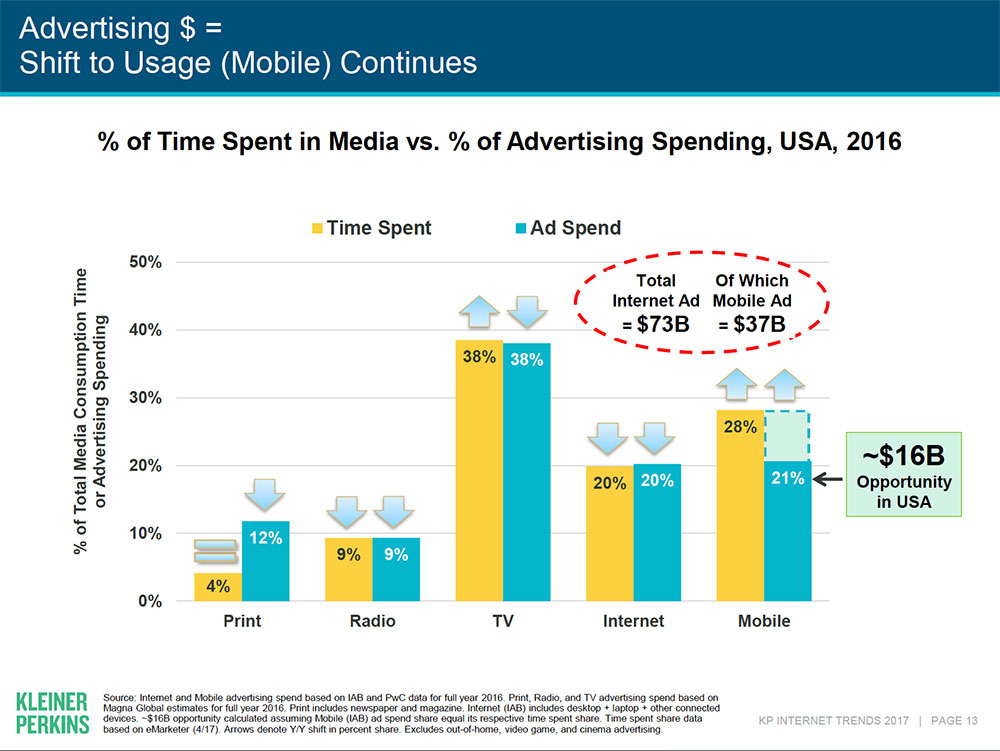
- However, ad spend on mobile does not yet reflect the time spent on these devices. It is thought that there needs to be more work done on methods of advertising.
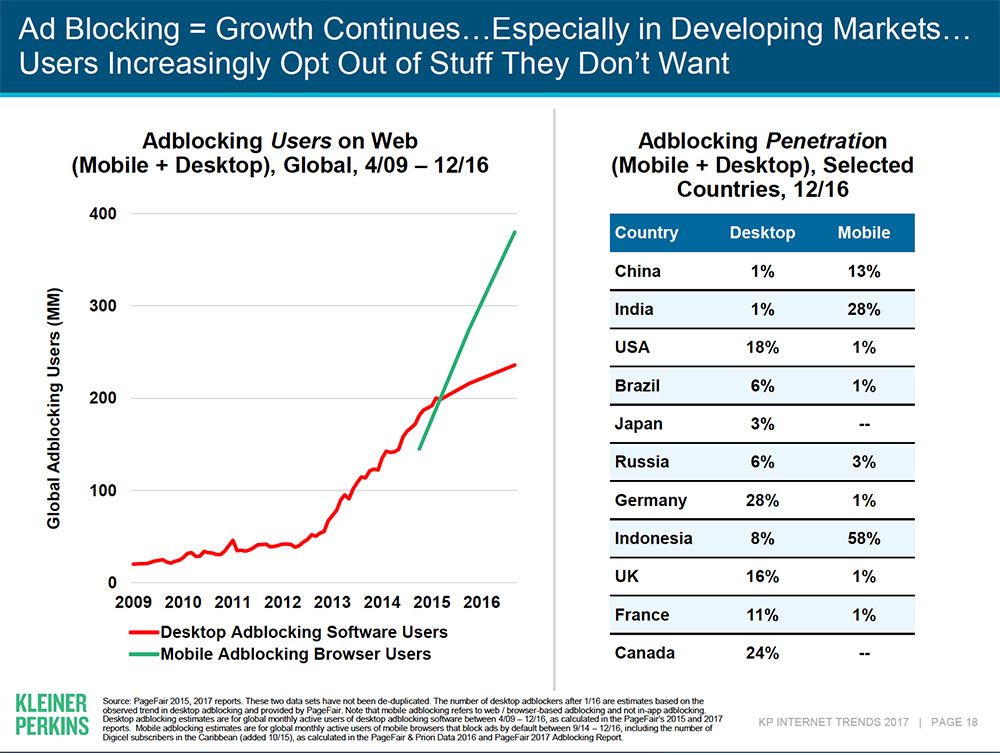
- Ad blocking is exploding in popularity, up to 16% in the UK on desktop.
- Ad spend on print remains way out of proportion to time spent with print media.
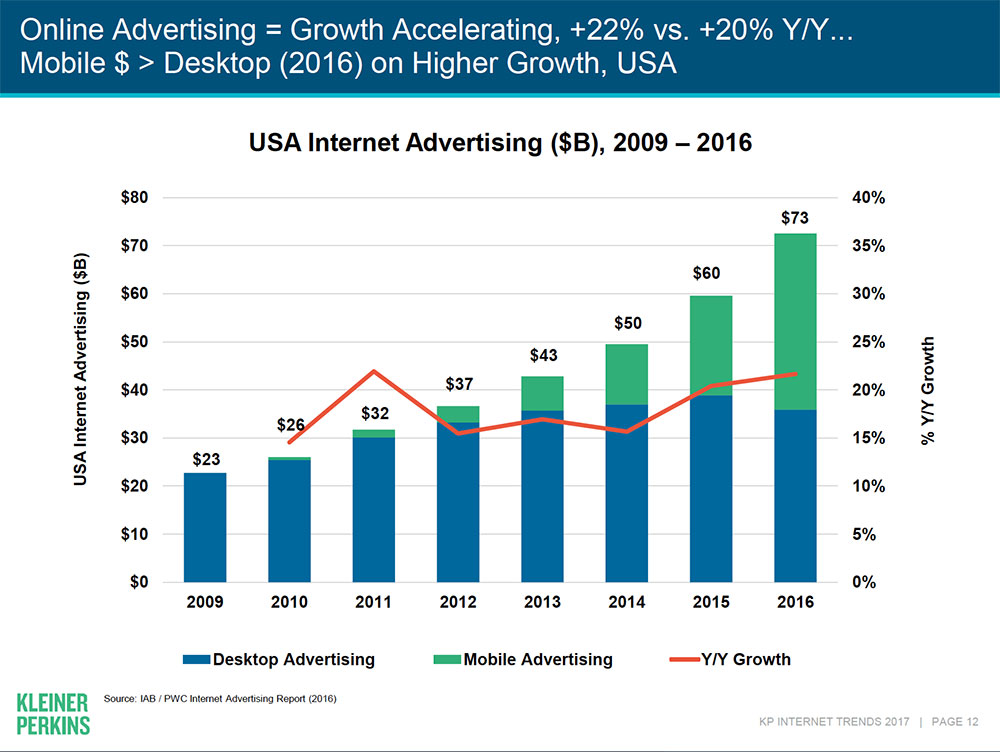
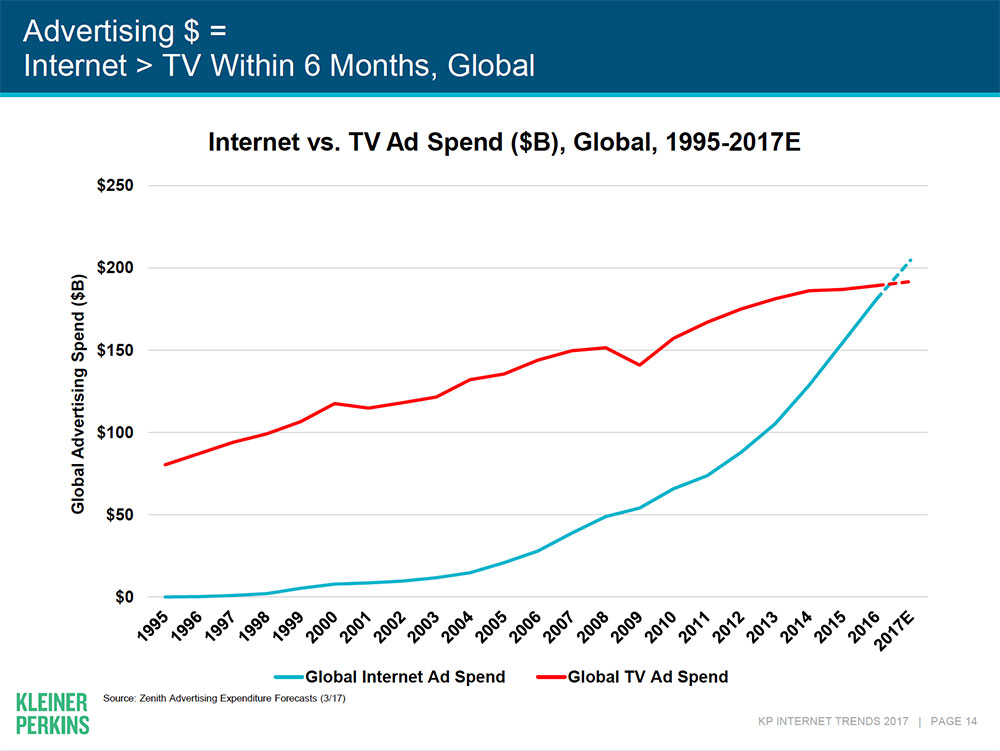
- Ad spend on the web finally overtook ad spend on TV.
- Social media advertisers report valuing engagement above other metrics and find measuring ROI (Return on Investment) the biggest challenge.
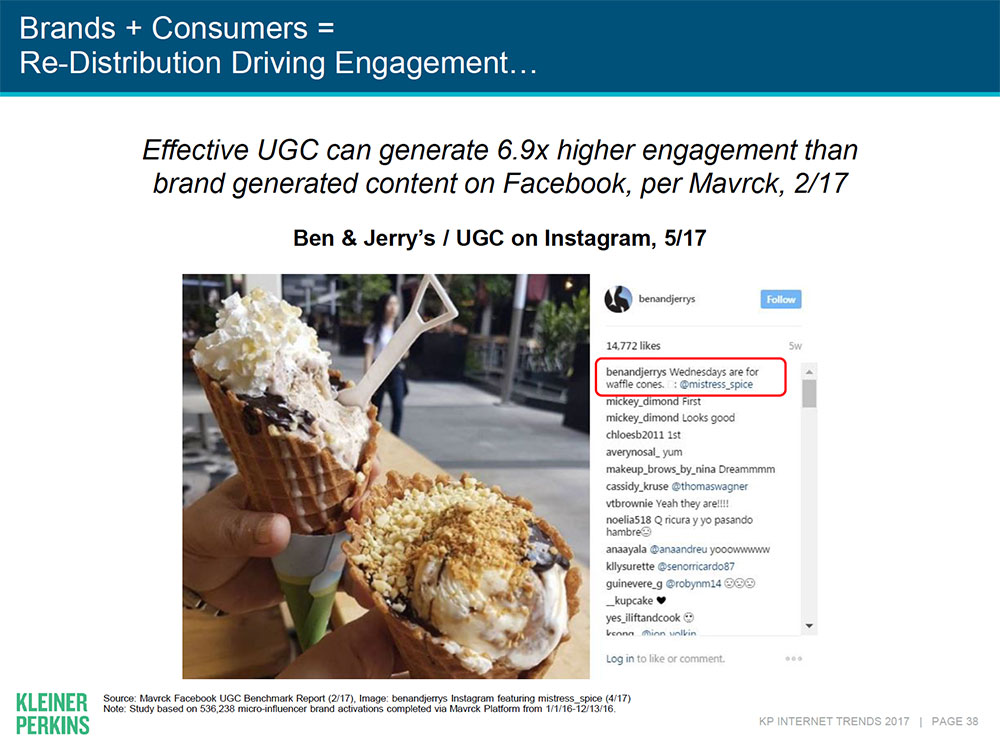
- User generated content collected by brands for ad purposes is 6.9% more effective than brand generated content
Reputation & Customer Satisfaction
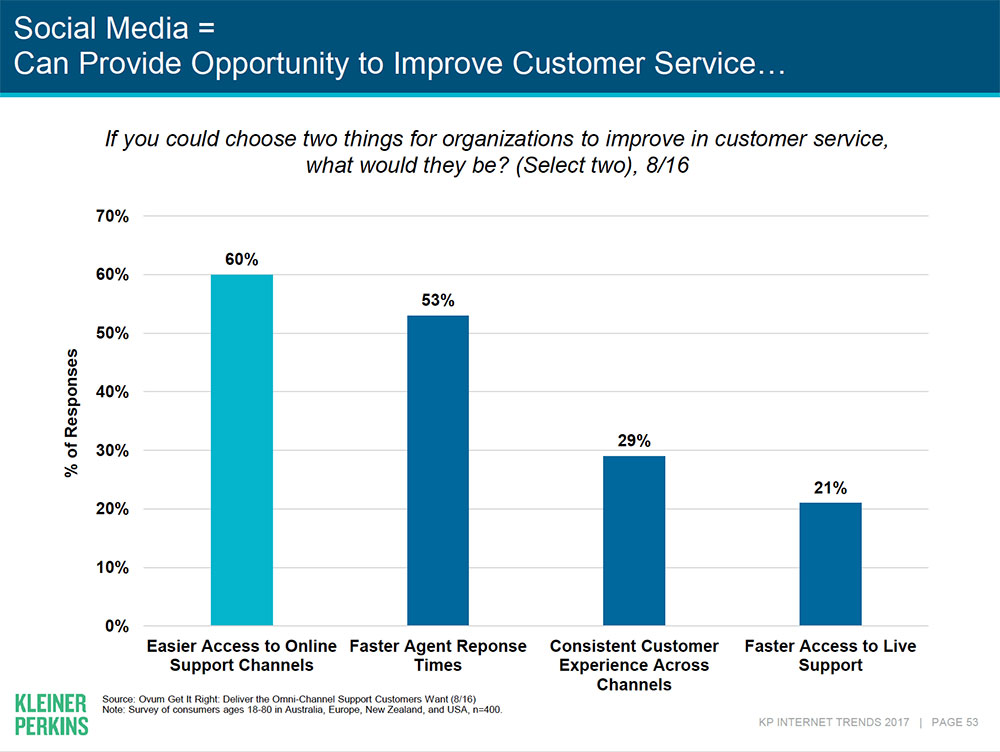
- The most important thing brands can do to improve customer service is to provide easier access to online support channels, with fast response.
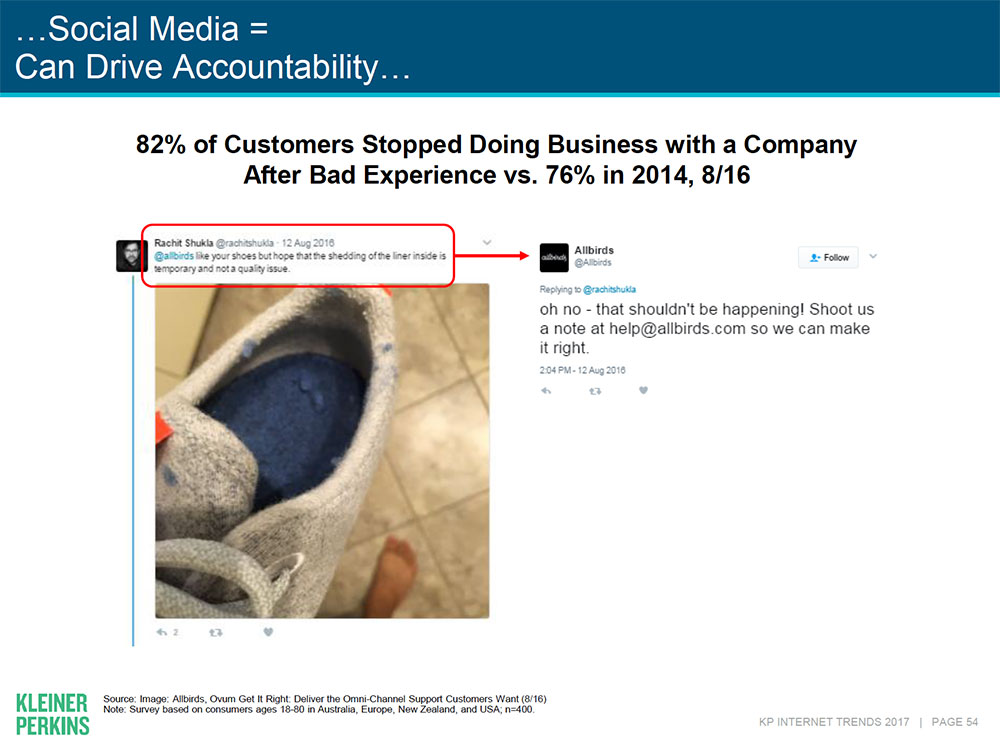
- 82% of people will stop doing business with a company after a bad experience in 2016 vs 76% in 2014.
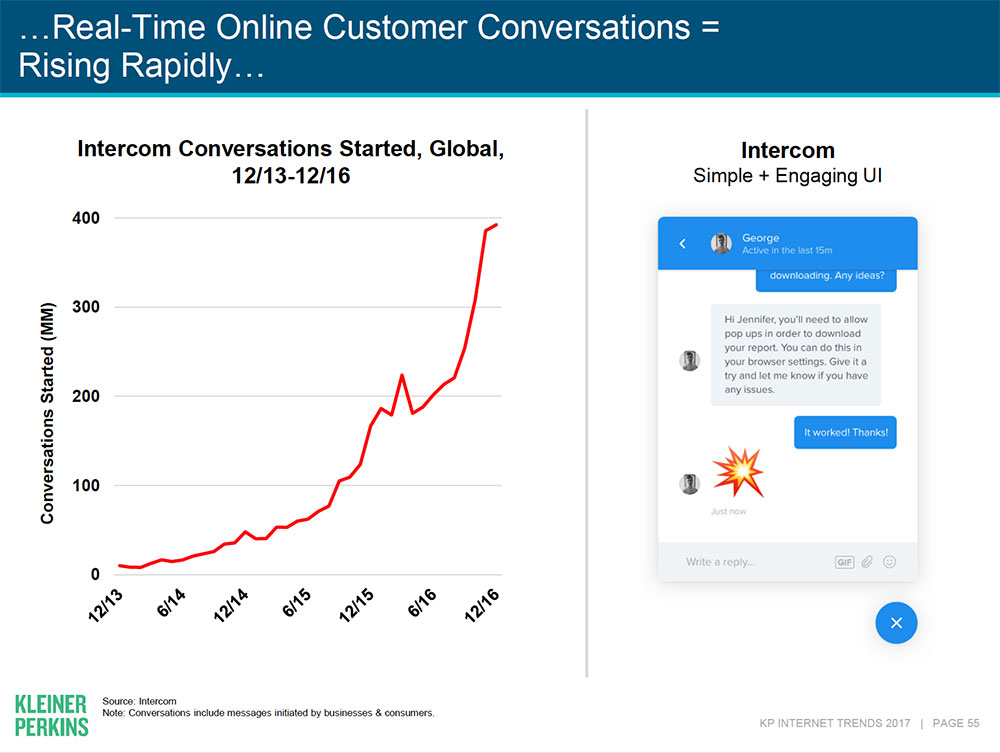
- Real time customer interactions matter and are becoming the norm.
- There is a clear correlation between highly engaged online communities, great customer satisfaction and revenue growth
eCommerce
- Buy it again buttons can increase sales by 8%.
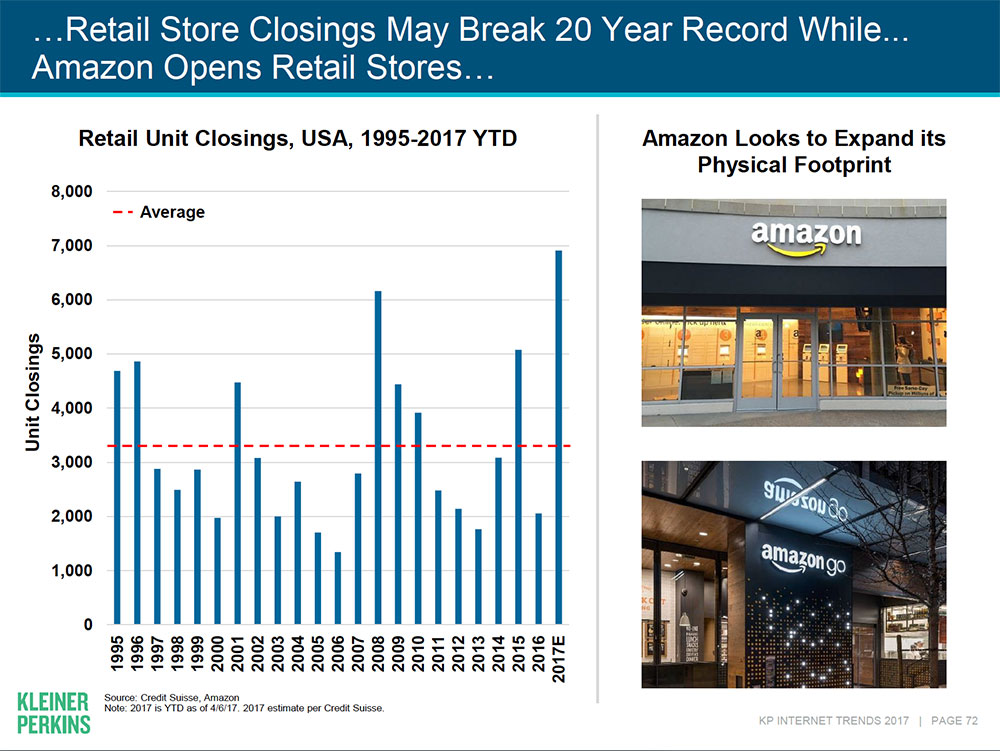
- While traditional retail is dying, online retailers, like Amazon, are opening walk-in stores with a fresh retail experience.
- Private label (Big brands buying local and selling under their own name) is growing in popularity
- Subscription businesses are booming – see Amazon Prime, Netflix, Dropbox.

